Dear community,
After several months of quiet work, we are pleased to announce the release of version 1.3 of the Open Soil Spectral Library (OSSL), along with a redesigned library catalog and a new no-code tool to explore and model OSSL data directly in your browser. Ran Zhi, a postdoctoral researcher who recently joined our team at Woodwell Climate, made this release possible in large part.
Version 1.3 adds nine spectral libraries, bringing the collection to twenty contributing datasets from around the world. We are deeply grateful to the researchers and institutions who have generously shared their data openly, and we hope more people will contribute their own soil spectral libraries.
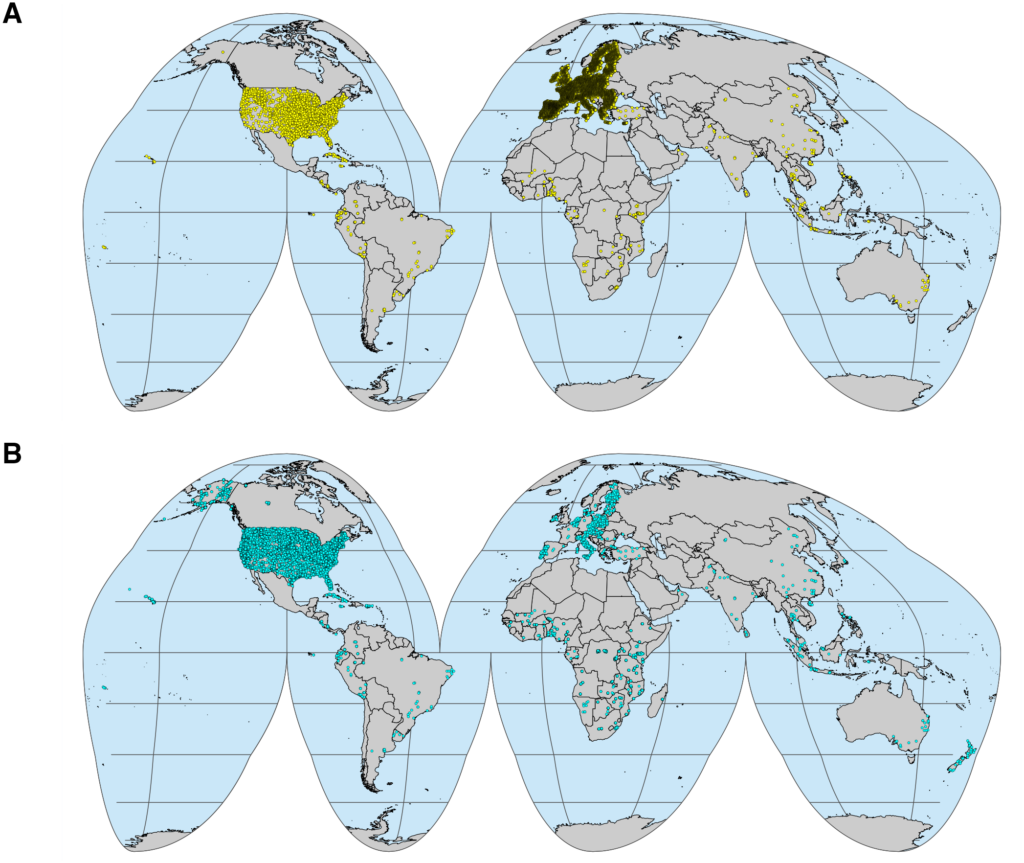
The biggest change in this release is how we provide the data. Version 1.3 follows the previous format but introduces a simpler, standardized database structure: every dataset is now individualized while preserving original soil property measurements and spectral information. Rather than reducing each library to a shared set of properties and spectral range (due to their inherent heterogeneity), we retain the full richness of each contributor’s data and present it dataset by dataset, following our internal specifications. A single harmonized table for cross-dataset modeling, similar to v1.2, is not yet available for v1.3. Note that some dataset codes have changed (for example, AFSIS is now AFSIS1 and Serbia is now SRB; see Table 1). We will work on a fully harmonized version of the database for cross-dataset modeling and share it in a future release.
An important note on the KSSL MIR dataset. Following changes to the USDA-NRCS data privacy policy, we removed many samples from the KSSL library in this release. KSSL now includes approximately 60k samples, down from 85k in v1.2. If your work relied on KSSL data from v1.2, please expect fewer samples in v1.3, and be careful when comparing models or results across the two versions.
| New code | Old code | Description | Sample size | Spectral range | Version |
|---|---|---|---|---|---|
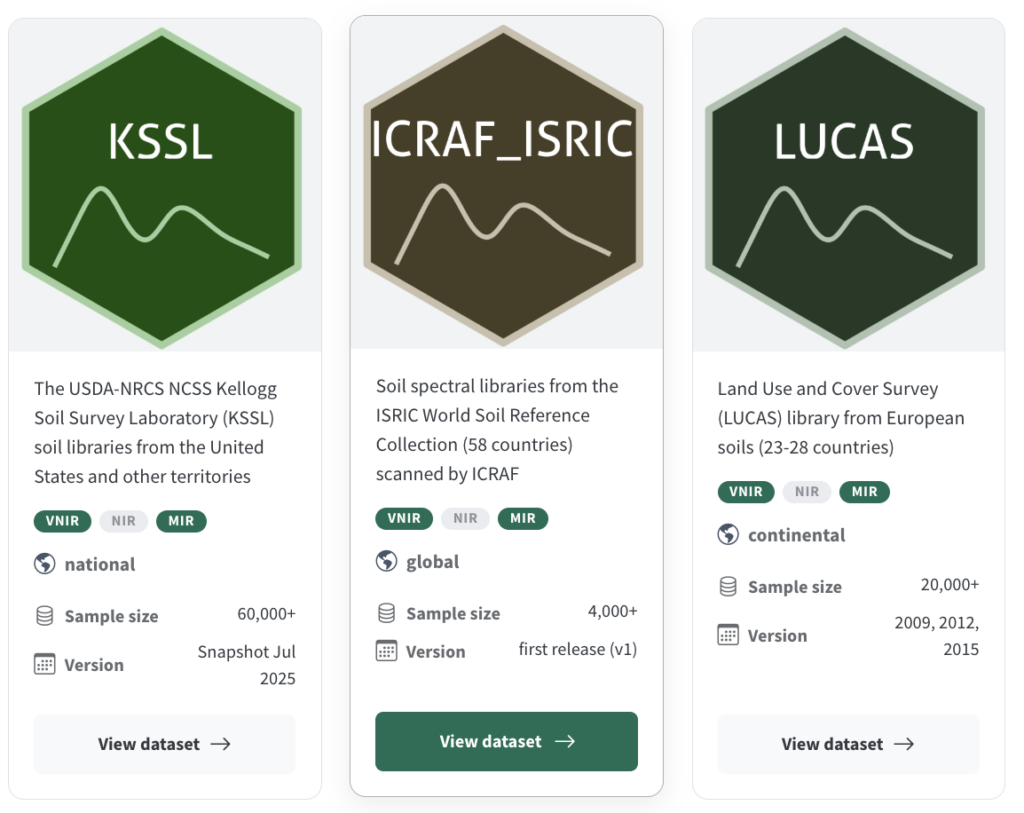
| KSSL | KSSL | USDA-NRCS Kellogg Soil Survey Laboratory libraries, USA and territories | 60,000+ | VisNIR, MIR | v1.2, v1.3 |
| ICRAF_ISRIC | ICRAF_ISRIC | ISRIC World Soil Reference Collection (58 countries), scanned by ICRAF | 4,000+ | VisNIR, MIR | v1.2, v1.3 |
| LUCAS | LUCAS | Land Use and Cover Survey, European soils (23–28 countries) | 20,000+ | VisNIR, MIR | v1.2, v1.3 |
| AFSIS1 | AFSIS | Africa Soil Information Service Phase I, Africa | 1,000+ | MIR | v1.2, v1.3 |
| AFSIS2 | AFSIS2 | Africa Soil Information Service Phase II, Africa | <1,000 | MIR | v1.2, v1.3 |
| CAF | CAF | Central Africa | 1,000+ | MIR | v1.2, v1.3 |
| NEON | NEON | National Ecological Observatory Network, USA | <300 | MIR | v1.2, v1.3 |
| HLF_CAN | Schiedung | High-Latitude Forests of North Canada | <300 | MIR | v1.2, v1.3 |
| PF_NZL | Garrett | Planted Forest soils of New Zealand | <1,000 | MIR | v1.2, v1.3 |
| SRB | Serbia | Serbian soils | <300 | MIR | v1.2, v1.3 |
| Neospectra | Neospectra | Neospectra handheld NIR, selected KSSL samples (USA) and Africa | 2,000+ | NIR | v1.2, v1.3 |
| BESB | — | Brazilian Soil Spectral Library | 15,000+ | VisNIR, MIR | v1.3 |
| HSDOS | — | Hungarian Soil Degradation Observation System | 5,000+ | VisNIR | v1.3 |
| AUT | — | Austrian NIR library for soil health assessments | 2,000+ | NIR | v1.3 |
| GEMAS | — | Geochemical Mapping of Agricultural and Grazing Land Soil, Europe | 4,000+ | NIR | v1.3 |
| Geocradle | — | Geocradle region (Balkans, Middle East, North Africa) | 1,000+ | VisNIR | v1.3 |
| MTQ | — | Rural areas of Martinique island | <1,000 | NIR | v1.3 |
| LF_BRA | — | Two farm-scale sites, Brazil | <300 | VisNIR | v1.3 |
| GPKOR | — | Gyeonggi Province, South Korea | 1,000+ | NIR | v1.3 |
| WS_SWIND | — | Tropical and sub-humid watersheds of Southwestern India | <300 | MIR | v1.3 |
To make the libraries easier to explore, we have created the Soil Spectral Libraries section of the OSSL Manual. Each dataset appears as a card showing its geographic extent, spectral ranges, and sample size at a glance, and you can filter by region or spectral type. Each dataset also has its own page with a sample location map, download links, soil properties, spectral metadata and plots, and links to the original publications and data providers.
We are also excited to share a tool built in response to a frequent community request: an easier way to pull OSSL data and build your own models. The OSSL Chemometrics app guides you through a complete workflow in your browser. Browse the available datasets, then build a subset tailored to your needs by filtering and joining the site, laboratory, and spectra tables before exporting. If you have your own spectra, the My Data option resamples them to a standard interval so they are ready to use alongside the OSSL. Finally, the Analyze step runs the mdatools apps (developed by Sergey Kucheryavskiy) for spectral preprocessing, principal component analysis (PCA), and PLSR modeling, with no installation required. Everything runs locally in your browser, so your data never leaves your computer.
One heads-up: the first load can take 10–30 seconds while the app sets itself up in your browser (it is built with Shinylive/WebAssembly, Parquet, and DuckDB). After that, it is fast, and repeat visits are much quicker.
We invite you to explore the updated catalog and try the Chemometrics app. If you would like to contribute a library, we have a contribution template to help you get started, and we always welcome feedback.
To stay informed about new papers and community resources, follow our initiative on LinkedIn.
Best regards,
Soil Spectroscopy for the Global Good team
soilspec4gg@woodwellclimate.org